

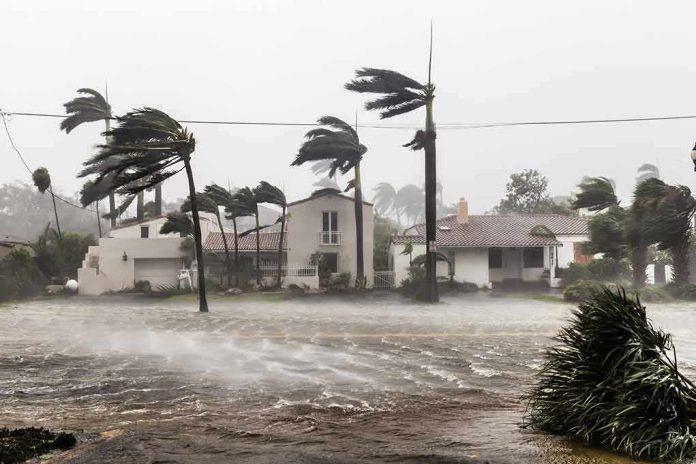
California’s defining water hazard is not a hypothetical superstorm conjured for headlines but a physically credible chain of events we have seen before: a weeks-long barrage of atmospheric rivers that turns much of the state into a temporary inland sea. The ARkStorm work led by the U.S. Geological Survey does not predict a date; it shows, with historical and geologic backing, how a plausible storm sequence could flood thousands of square miles, trigger landslides by the thousands, and interrupt modern lifelines on a scale the state has not tested in living memory.
At a Glance
- ARkStorm is a scientifically constructed scenario, not a forecast, built to mirror the 1861–62 California floods and to test today’s vulnerabilities.
- USGS modeling indicates statewide flooding affecting urban hubs and the Central Valley, with economic losses on the order of hundreds of billions of dollars.
- Paleoclimate records show extreme, multi-millennial rainfall episodes larger than modern instrumented events, underscoring the hazard’s recurrence over deep time.
- Atmospheric rivers are the mechanism: narrow, moisture-rich plumes capable of extreme precipitation, coastal inundation, and rapid-onset landslides.
What ARkStorm actually is: a stress test built from history and physics
ARkStorm is a scenario—an evidence-based, assembled event that answers a practical question: what happens when California is hit by a historically realistic sequence of very large winter storms? USGS designed it to resemble the 1861–62 deluge that rendered the Central Valley impassable, then layered in modern exposure: dense coastal metros, vast agricultural systems, and interdependent networks for power, water, transport, and digital communications. The scenario’s point is consequence, not timing: it quantifies plausible damages and cascading failures if a storm of that character struck the California of today.
The backbone is familiar meteorology. Atmospheric rivers—long, narrow corridors of water vapor in the lower troposphere—deliver much of the West Coast’s cold-season precipitation. When they stall or arrive in clusters, they produce sustained high-intensity rainfall, snowline shifts, and saturated soils that convert hillslopes and burn scars into debris-flow conduits. ARkStorm scales that mechanism statewide, linking storm hydrology to levee stress, reservoir operations, and urban drainage, then to economic interruption.
Statewide flooding as a realistic outcome, not a rhetorical flourish
USGS summarizes the expected footprint bluntly: an ARkStorm-scale event can flood thousands of square miles of urban and agricultural land, generate thousands of landslides, and disrupt critical lifelines for days to weeks. The modeled losses reach roughly $725 billion—orders of magnitude beyond routine flood seasons and squarely in the range of systemwide disasters. This is not a valley-only riverine flood; the scenario includes the Central Valley, the San Francisco Bay shoreline, Los Angeles and Orange Counties, San Diego, coastal communities, and river-dependent towns across the map. In other words, the hazard is integrated. So are the consequences.
The Central Valley drives home the point. Even with extensive levee networks and large reservoirs, a prolonged sequence of high-intensity storms can outstrip conveyance capacity and erode earthen defenses. Once water is on the floodplain, it seeks ancient paths; inundation lingers where gradients are small and drainage is controlled by weirs and pumps. In the ARkStorm construct, these hydraulics intersect with modern land use: warehouses, logistics hubs, dairies, and power substations that did not exist in 1862 but are central to today’s economy.
Why the 1861–62 floods still matter—and what the sediments say beyond that
Skeptics sometimes treat 1861–62 as a one-off. It was not. USGS anchored ARkStorm to that event because it is the best documented example of a weeks-long storm barrage that transformed California’s hydrology and governance; the state’s capital moved temporarily, and vast tracts were underwater. The point is not nostalgia for an outlier—it is that the mechanisms are repeatable and, under the right configuration of storm tracks, jet dynamics, and antecedent saturation, scalable to modern exposure.
Then the paleoclimate record extends the time horizon. Sediment cores from Leonard Lake reconstruct roughly 3,000 years of atmospheric-river activity and reveal periods when extreme rainfall exceeded events in the instrumental era—peaks about two and three millennia ago stand out in the proxy data. Proxies lack the spatial fidelity of modern radar, but they puncture the illusion that recent decades bound the possible. California has repeatedly experienced hydrologic regimes capable of producing extraordinary precipitation; those regimes are part of the state’s long-run climate, not an anomaly imported by contemporary discourse.
Mechanism and compounding factors: how severe storm sequences become megafloods
In practice, AR-driven megafloods are compound events. The atmosphere provides integrated vapor transport and repeated landfalls; the snowline lifts, turning high-country catchments from storage into runoff; soils saturate, raising runoff coefficients storm by storm; debris flows originate on burned or weak slopes, clogging culverts and channels; tides and storm surge compound coastal inundation. Modern vulnerabilities exacerbate the hydrology: development on historical floodplains, aging levees, subsided islands in the Bay-Delta, and the sheer density of critical nodes—substations, data centers, refineries—in low-lying zones.
Forecasting has improved materially. NOAA’s Advanced Quantitative Precipitation Information program works to refine radar-based precipitation estimates and short-term streamflow and coastal inundation forecasts during atmospheric river episodes, giving operators tighter lead time to reposition crews, pre-release reservoirs where safe, and stage pumps. But sharper prediction does not eliminate exposure; it buys decision time. That margin is invaluable in clustered events, where the second or third storm in a sequence often inflicts disproportionate damage as systems fail under cumulative stress.
What the numbers mean—and what they do not
USGS’s roughly $725 billion loss figure is conditional: it is what a specified ARkStorm sequence would cost if it occurred under modeled assumptions about infrastructure, land use, and interdependencies. It is not an annual expected loss, nor a statement about imminent timing. That distinction matters because it moves the conversation from “will this happen next winter” to “are we prepared for when a physically plausible sequence does occur.” The latter is the correct frame for infrastructure finance, insurance, and emergency management. A single caveat belongs here: ARkStorm is a scenario rather than a dated forecast; its numbers communicate exposure under a large but plausible configuration, not a schedule.
Superlatives—“bigger than any disaster in world history”—are poor substitutes for specificity. The official materials support catastrophic statewide flooding and immense economic losses; they do not certify every headline-friendly statistic or ranking. The credible claim, and the one that should drive policy, is simpler: California faces a low-frequency, high-consequence flood risk that can overwhelm modern systems across the entire state.
There’s a lot of hype about an extremely active and wet pattern in Northern California by mid-Nov. While that is a possibility, it’s not depicted very well by the ensembles. The EPS ensemble average shows a notably wetter than usual period in mid-Nov, but nothing alarming (It’s… pic.twitter.com/DSmZEYgHy8
— Western U.S. Weather Discussion (@o41036) November 3, 2026
Preparation that matches the hazard
Serious preparedness follows the hazard’s structure. In river corridors and the Central Valley, hydraulic modeling of alternative levee-failure sequences and reservoir operations clarifies where water will go and how long it will stay. In coastal metros, combined sea-level anomalies, tide cycles, and AR storm surge define hot spots along bays and estuaries. Everywhere, lifeline interdependencies deserve the same rigor as levees: where are the electrical and telecom nodes below projected flood elevations; how quickly can wastewater plants be isolated or fortified; which logistics hubs require elevating or floodproofing to prevent region-wide supply disruption.
There is also an uncomfortable governance point. A megaflood does not respect county lines or agency charters. The footprint in ARkStorm crosses water districts, reclamation districts, state and federal reservoirs, urban stormwater systems, and state-federal levee jurisdictions. Fragmented authority is a vulnerability as real as a weak embankment. Scenario-driven exercises—grounded in ARkStorm-scale assumptions—are one of the few tools that force coherent planning across those seams.
The bottom line
The science is not ambiguous about the mechanism or the plausible consequences. Atmospheric rivers have produced California’s worst floods; they will do so again. ARkStorm translates that into a modern stress test with consequences large enough to matter for budgets, insurance portfolios, and public safety. Treat it as it was designed: not a doomsday clock, but a map of where today’s systems break when yesterday’s storms return at scale. The right response is unglamorous—modeling, reinforcement, staged redundancies, and frank interagency coordination—but it is exactly how you convert a known, repeatable hazard into a survivable event.
Sources:
youtube.com, usgs.gov, cw3e.ucsd.edu, usatoday.com